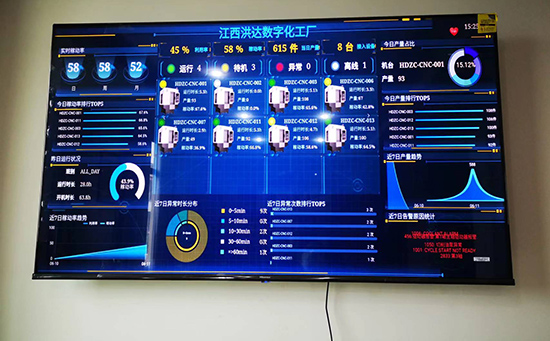
ERP系统 & MES 生产管理系统
10万用户实施案例,ERP 系统实现微信、销售、库存、生产、财务、人资、办公等一体化管理
Understanding Excel’s LINEST Function: A Comprehensive Guide
Excel’s LINEST function is a powerful tool for performing linear regression analysis directly within your spreadsheets. Whether you’re a data analyst, scientist, or business professional, mastering LINEST can greatly enhance your ability to interpret and utilize data effectively.
What is the LINEST Function?
The LINEST function in Excel is designed to calculate key statistics for a line that best fits your data. It provides essential metrics such as slope, intercept, R-squared value, standard error, and more. These statistics are crucial for understanding the relationship between variables and making informed decisions based on data trends.
Using LINEST for Linear Regression
To perform linear regression using LINEST, you need a set of known x and y values. Excel will then generate the coefficients that define the best-fit line through your data points. This process allows you to predict future values, assess the strength of correlations, and validate assumptions within your dataset.
Step-by-Step Guide to Using LINEST
1. Preparing Your Data: Ensure your x and y data sets are organized in columns within Excel.
2. Entering the LINEST Formula: In a blank cell, enter `=LINEST(y_data, x_data, const, stats)` where `y_data` and `x_data` are your data ranges, `const` is either TRUE or FALSE to include/exclude the intercept, and `stats` determines which additional statistics to return.
3. Understanding the Results: Excel returns an array of values. Key outputs include the slope (m), intercept (b), standard error, and coefficients. Each statistic provides insights into the regression model’s accuracy and reliability.
Interpreting LINEST Results
– Slope (m): Represents the rate of change of y with respect to x.
– Intercept (b): Indicates the y-intercept of the regression line.
– R-squared (R2): Measures the goodness of fit, showing how well the regression line approximates the data points.
– Standard Error: Reflects the accuracy of the regression predictions.
– Coefficients: Detailed values for each variable used in the regression.
Applications of LINEST in Business
The LINEST function is invaluable across various industries:
– Financial Forecasting: Predicting future sales based on historical data.
– Market Analysis: Understanding correlations between marketing spend and revenue.
– Quality Control: Assessing relationships between process variables and product quality.
Conclusion: Leveraging Excel’s LINEST Function for Data Insights
Mastering Excel’s LINEST function empowers users to derive meaningful insights from data through rigorous statistical analysis. By understanding its outputs and applications, professionals can make informed decisions, enhance predictions, and optimize processes effectively. Embrace LINEST to unlock the full potential of your data analysis capabilities in Excel.


 咨询顾问
咨询顾问