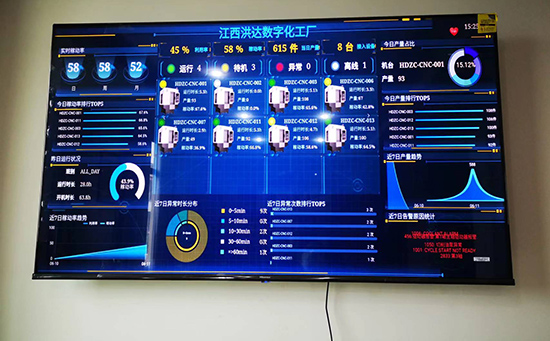
ERP系统 & MES 生产管理系统
10万用户实施案例,ERP 系统实现微信、销售、库存、生产、财务、人资、办公等一体化管理
Understanding Excel Functions and Their Applications in Data Analysis
Excel, developed by Microsoft, stands as a powerful tool for data analysis and management. Through its numerous functions, Excel empowers users to perform complex calculations, organize data efficiently, and derive valuable insights. This article delves into several essential Excel functions, exploring their practical applications and benefits in various analytical tasks.
1. SUM Function: Streamlining Data Summation
The SUM function in Excel is fundamental, enabling users to quickly calculate the total of a range of cells. By using simple syntax (=SUM(range)), users can add up numbers across rows or columns effortlessly. This function is invaluable in financial modeling, budgeting, and any scenario requiring rapid aggregation of numerical data.
2. VLOOKUP Function: Enhancing Data Search and Retrieval
For data lookup tasks, the VLOOKUP function proves indispensable. It allows users to search for a specific value in the leftmost column of a table and retrieve corresponding data from a specified column. This function is widely used in databases, inventory management, and maintaining organized records.
3. IF Function: Introducing Conditional Logic
The IF function facilitates decision-making based on specified conditions. Users can set criteria to test whether a certain condition is met, returning one value if true and another if false. This logical function is pivotal in creating dynamic spreadsheets, generating reports, and automating data-driven processes.
4. COUNTIFS Function: Advanced Data Filtering
To count cells that meet multiple criteria, Excel offers the COUNTIFS function. This function supports complex criteria across multiple ranges, allowing users to perform detailed data analysis efficiently. It finds application in statistical analysis, survey data processing, and quality control assessments.
5. CONCATENATE Function: Stringing Data Together
The CONCATENATE function combines text strings from multiple cells into a single cell. It simplifies the creation of mailing labels, personalized reports, and concatenated data fields. Excel users leverage this function for formatting cells and enhancing data presentation in various professional contexts.
6. PIVOT TABLES: Dynamic Data Summarization
Excel’s PivotTables feature offers powerful tools for data summarization and analysis. By summarizing large datasets into manageable views, PivotTables enable users to extract meaningful insights swiftly. This functionality is crucial in business intelligence, sales analysis, and project management reporting.
Exploring Excel Functions for Enhanced Productivity and Analysis
In conclusion, Excel functions serve as vital tools for users seeking to streamline data analysis, enhance productivity, and derive actionable insights. By mastering these functions—SUM, VLOOKUP, IF, COUNTIFS, CONCATENATE, and PivotTables—users can manipulate data effectively, optimize workflow processes, and make informed decisions across various professional domains. Harnessing Excel’s capabilities empowers individuals and organizations to excel in data-driven environments, fostering efficiency and informed decision-making without unnecessary complexity.


 咨询顾问
咨询顾问